Products
- SQL Frames
- SQL Frames Designer
- Sheets BI

SQL Frames Runtime Library (simply referred as SQL Frames), available as @sqlframes/repl-app, allows creating in-browser embedded analytics applications using low-code API and create innovative solutions to provide Excel-like UX to the end users. This is suitable for SAAS companies and internal productivity and tools development teams who have developers that can put together a well integrated solution into their existing web applications.

The user interface can be completely customized to meet the branding requirements. The low-code API offers the ultimate flexibility to make the final experience seamlessly integrated into the application. It is UI framework agnostic and can be integrated with web apps written using React, Vue, AngularJS and others.
This library is already being used in production by our customers.
The online docs is filled with live examples using the low-code API to get a sense of the UX (user experience) and also DX (developer experience).
Next up the stack is the SQL Frames Designer that provides the ability to create no-code reports and dashboards by non-technical people. It leverages the low-code API SQL Frames Runtime Library and provides the no-code experience with prescribed UX to create pivot tables, charts and dashboards.

See Pivot Table Designer, Chart Designer and Workbook Designer. You can try them out with your own data!
See docs for more screen recordings of various flows to get a feel for the UX of using the SQL Frames Designer.
Integration
SQL Frames Designer allows creating workbooks (containing one or more dashboards) from data sources based on REST APIs and local files. It stores the entire workbook definition as a simple JSON object.
Integrating with SQL Frames Designer is very easy. All that is required is
- REST API to save a workbook JSON.
- REST API to load a workbook JSON.
- REST API to load any data that needs to be analyzed.
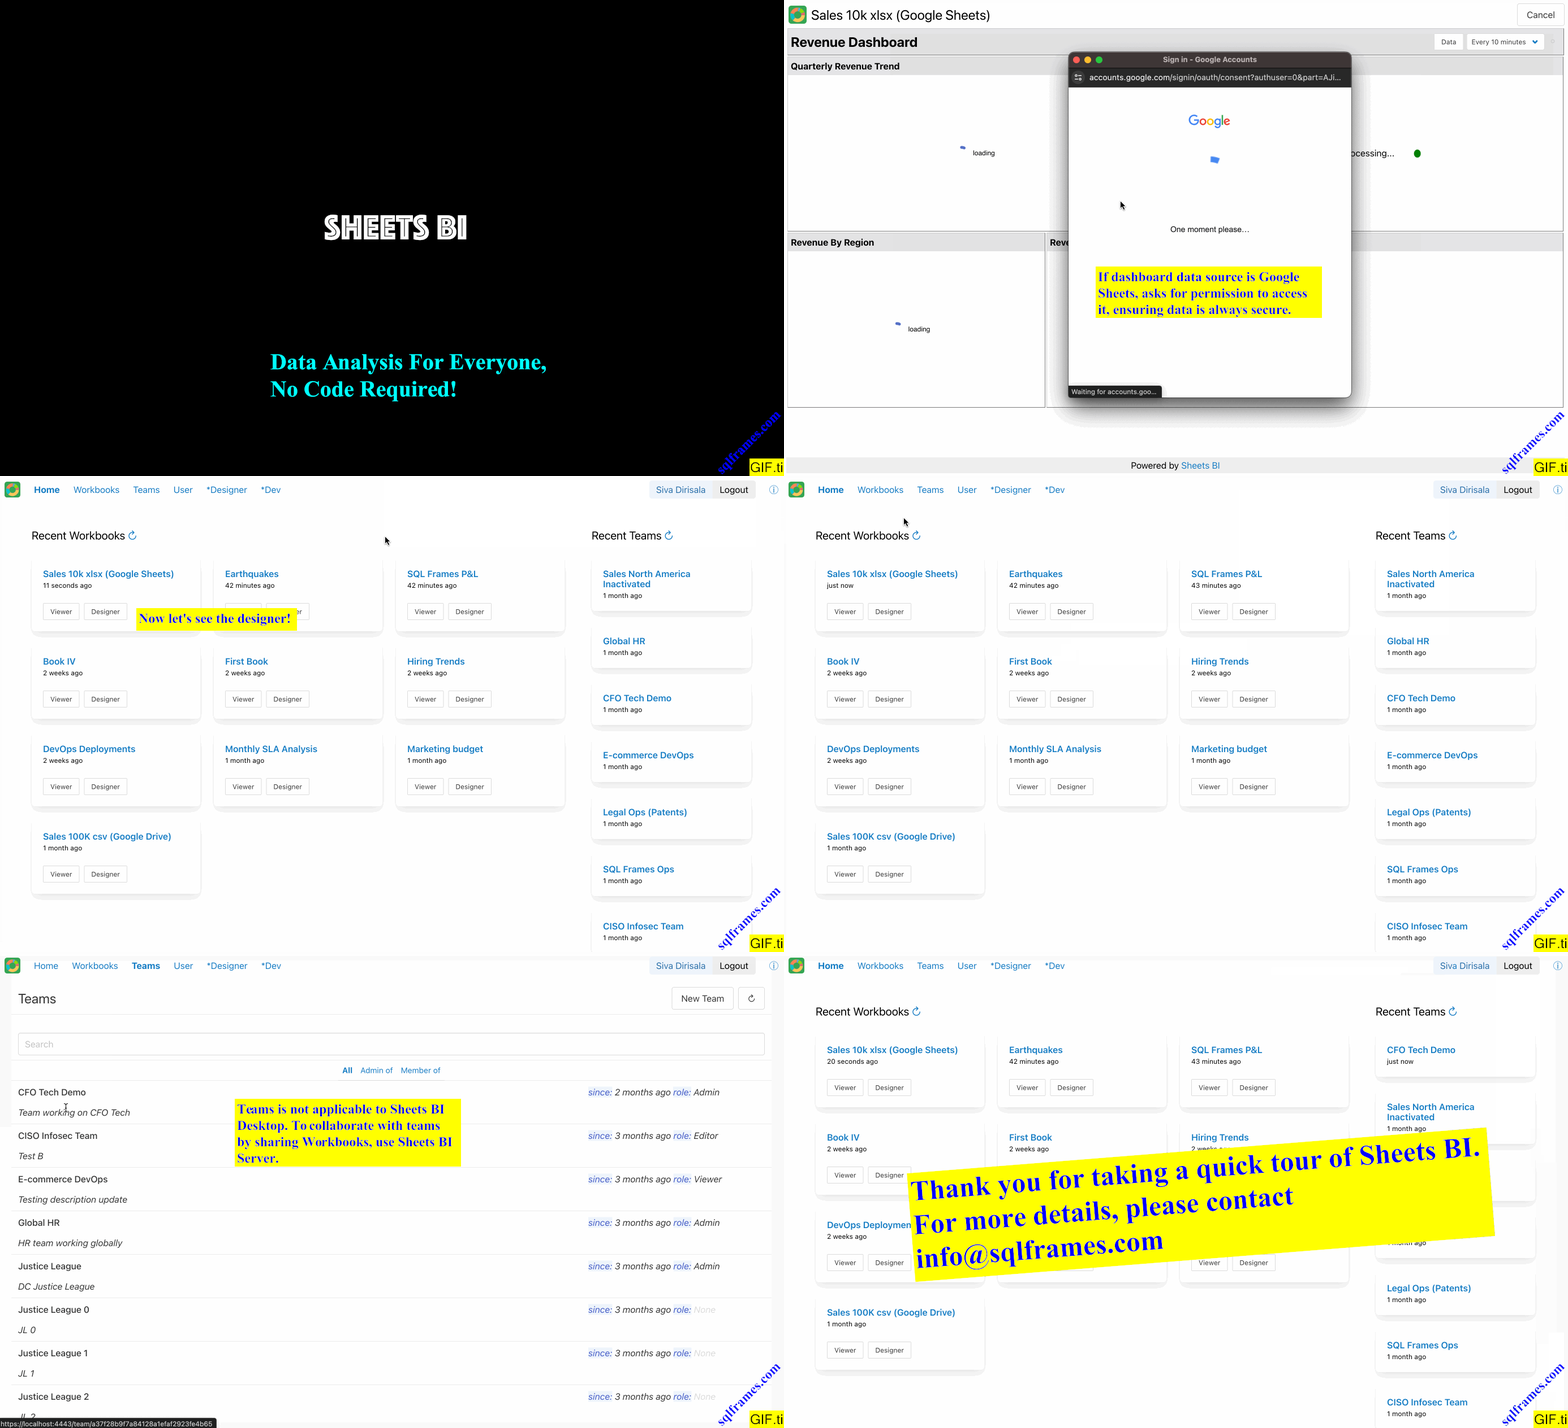
Sheets BI is an example APP that is integrated with SQL Frames Designer to provide analytics for your data on Google Sheets and Google Drive.
A senior full-stack engineer should be able to put together an integrated solution in under a month! Contact info @ sqlframes.com to learn more.
It is common for small and large organizations alike to have a lot of processes tracked via spreadsheets either directly using them as source of truth or storing data exports as spreadsheets. While Google Sheets provides the ability to create pivot tables and charts, there are many advantages to decoupling the data entry and the data analysis.
Leveraging the SQL Frames Runtime Library and the SQL Frames Designer, SLQ Frames Sheets BI is a fully functional BI application to create reports and dashboards from your Google Sheets, CSV and Excel Spreadsheest on Google Drive.

Visit Sheets BI to learn more.
Sheets BI Desktop is fully functional and completely free! Get it now